Spring Cloud Data Flow - Intro
Thursday Dec 26, 2019
Spring Cloud Data Flow
In this article we will look at Spring Cloud Data Flow.
Requirements
We’ll need Java and Maven installed and on out path. We are also going to use Docker, and we have a VM with Ubuntu and Docker running.
I was not able to get this to work out of the box on a Mac (likely due to the way Docker on Mac uses a VM to run, so it’s not really running locally).
Start the containers with Docker Compose
Official docs
Note: All of this is from the Spring documentation at https://dataflow.spring.io/docs/installation/local/docker/
The installation section covers different installation methods, it is here: https://dataflow.spring.io/docs/installation/
Install on a local VM
Login to your Docker host.
Make a directory and cd into it:
mkdir spring-cloud-data-flow && cd spring-cloud-data-flow
Get the docker compose file:
wget https://raw.githubusercontent.com/spring-cloud/spring-cloud-dataflow/v2.3.0.RELEASE/spring-cloud-dataflow-server/docker-compose.yml
or
curl https://raw.githubusercontent.com/spring-cloud/spring-cloud-dataflow/v2.3.0.RELEASE/spring-cloud-dataflow-server/docker-compose.yml >docker-compose.yml
Start the stack:
export DATAFLOW_VERSION=2.3.0.RELEASE
export SKIPPER_VERSION=2.2.1.RELEASE
docker-compose up
You’ll see some output like this before the logging starts:
Starting dataflow-mysql           ... done
Starting dataflow-kafka-zookeeper ... done
Starting skipper                  ... done
Starting dataflow-kafka           ... done
Starting dataflow-server          ... done
Starting dataflow-app-import      ... done
Attaching to dataflow-kafka-zookeeper, dataflow-kafka, dataflow-mysql, dataflow-server, skipper, dataflow-app-import
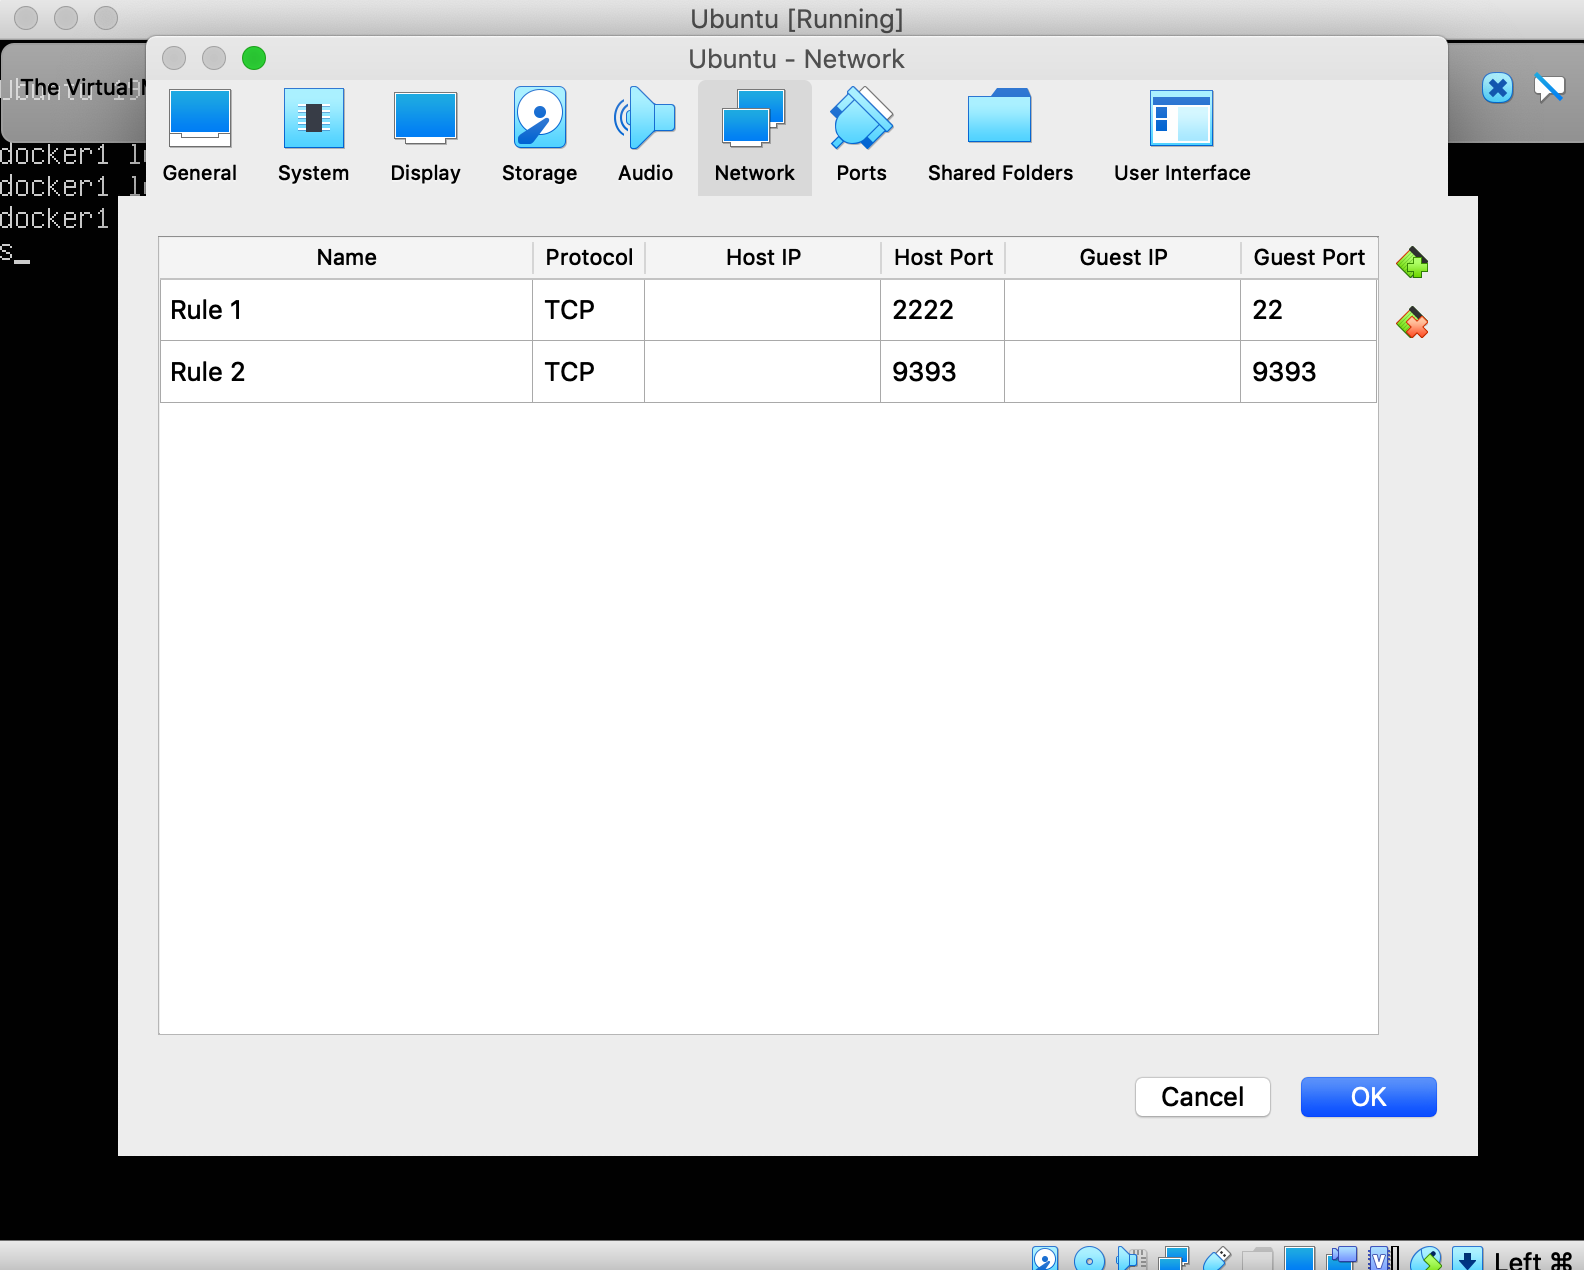
Again, since we are running in a VM using NAT for networking, I have ssh (port 2222 -> 22) forwarded from localhost, and we also need to forward port 9393 to access the Data Flow dashboard:
Now, we can login to the dashboard at http://localhost:9393/dashboard:
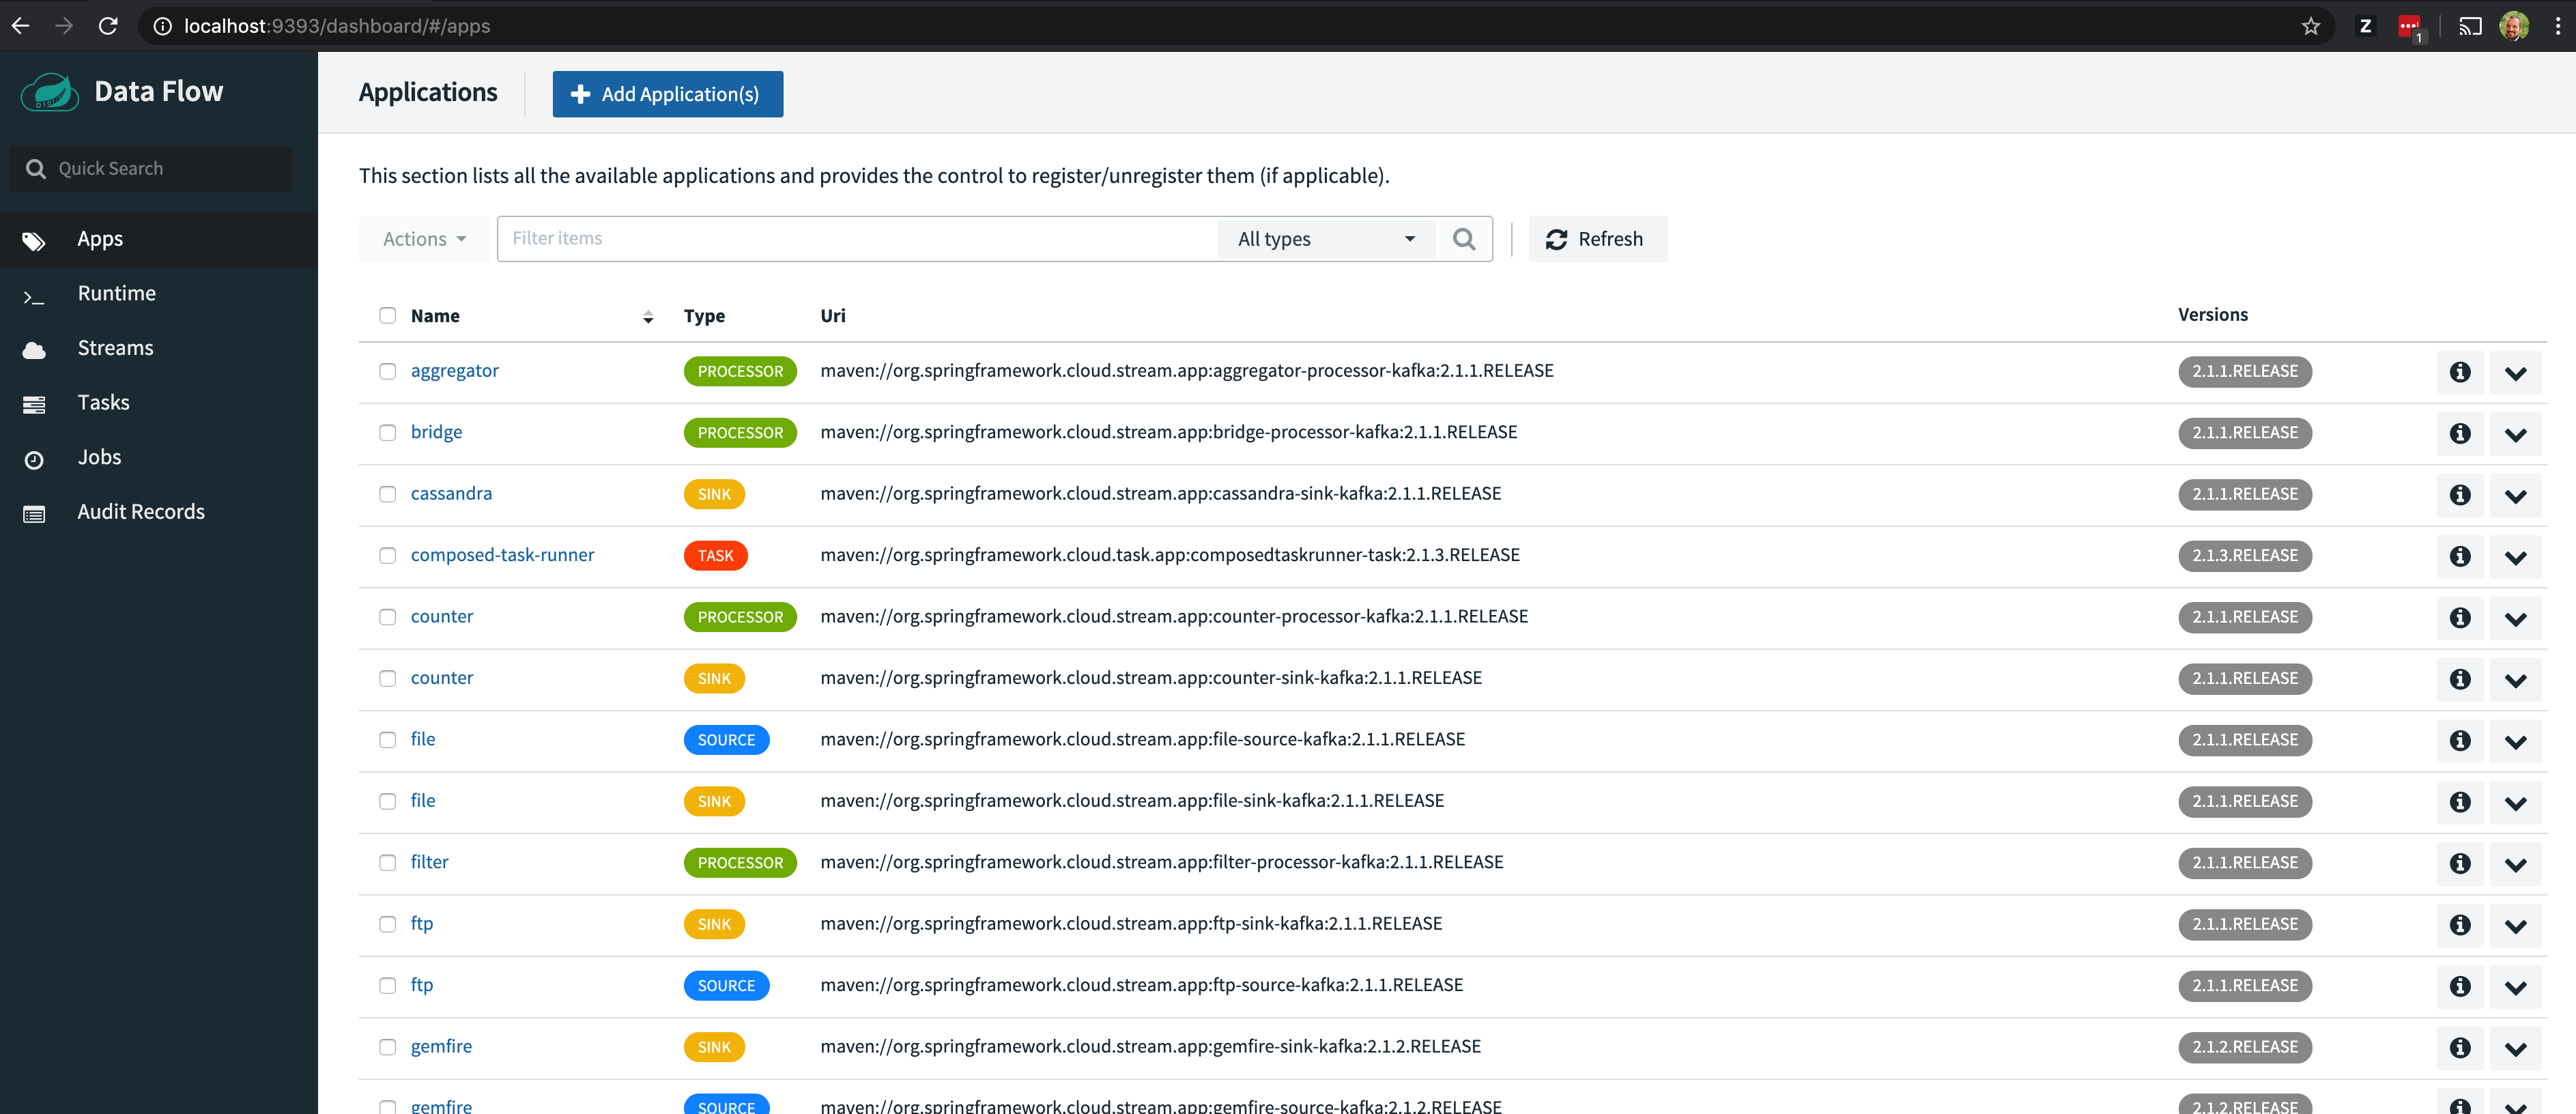
Once we can see the dashboard, we have the system up and running.
Creating our first Task
Next, we’ll create a simple task to see that we can run a job on the server.
- Click Tasks from the menu on the left
- Click the Create task(s) button at the top of the screen
- Drag the Timestamp task onto the graph between Start and End
- Connect the output port from Start to the input port of Timestamp by clicking and dragging the small circle at Start to the small circle at Timestamp
- Connect the output port from Timestamp to the input port of End by clicking and dragging
- Click the Create Task button and give it a name: “first-task-timestamp” for example:
Click the image below for a larger version:

Running our first task
Now that we have created a task, let’s run it:
- Click Tasks from the menu on the left
- Find the first-task-timestamp task in the list (it’s the only one if we’re starting from a new install). Note that the current status is “Unknown” since we have not run the task yet and click the launch task button that looks like a play button to the right of the task.
- After clicking the launch task button, a screen comes up that will allow you to enter Arguments and Parameters. Our job does not take any parameters or arguments, so we just click Launch the task
- After the task runs, reload the page and the Status should change to Complete
- Click the task name to see the summary of the task, and click Executions to see the execution history
Click the highest number (the latest) execution to see the information and log.
Note that you can only see logs from the latest execution when running tasks from the console. Each time you run a task it removes the logs from previous task runs.
Click the image below for a larger version: